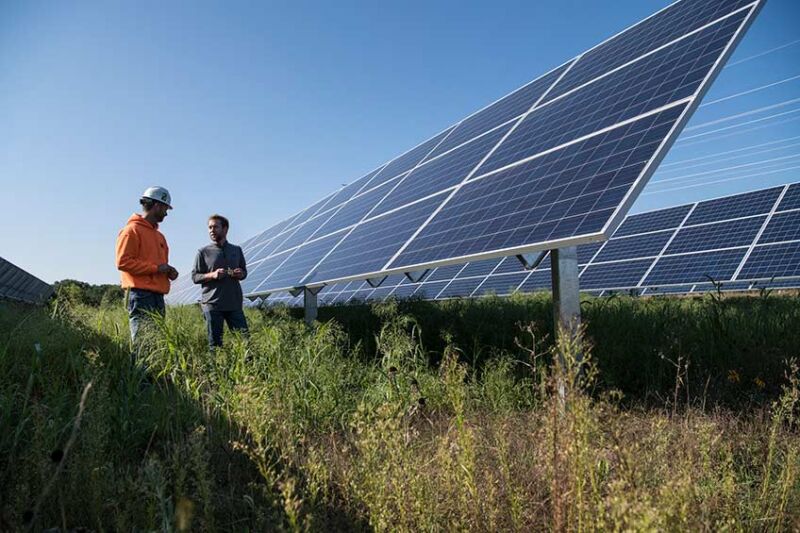
This week, the US Department of Energy's Berkeley Lab released its annual analysis of solar energy in the US. It found that nearly half the generating capacity was installed in the US during 2021 and is poised to dominate future installs. That's in part because costs have dropped by more than 75 percent since 2010; it's now often cheaper to build and operate a solar plant than it is to simply buy fuel for an existing natural gas plant.
The analysis was performed before the passage of the Inflation Reduction Act, which contains many incentives and tax breaks that should expand solar's advantages in the coming years.
Solar, by the numbers
In terms of large, utility-scale solar installs, the US added over 12.5 gigawatts of new capacity last year, bringing the total installed capacity to over 50 gigawatts. Texas led the way, with about a third of the total capacity added (3.9 GW) going online in the Lone Star State. Combined with residential and other distributed solar installations, solar alone accounted for 45 percent of the new generating capacity added to the grid last year.
That growth showed up in figures on how much energy solar supplies. Five states now receive more than 15 percent of their electricity from solar power, including Massachusetts and Vermont, with California receiving 25 percent of its electricity from the Sun.
Solar's expansion has largely been driven by falling costs. The DOE estimates that the price of building a solar plant has been dropping by an average of about 10 percent a year, leading to a fall of over 75 percent since 2010. That has left prices averaging about $1.35 for each watt of capacity in 2021. Large-scale plants benefit the most, with projects over 50 megawatts costing about 20 percent less than those under 20 MW.
The drop in prices is causing some somewhat odd trends, driven by the fact that it's becoming increasingly economical to install large facilities in states that don't get as much sun, like Maine, Michigan, and Wisconsin. As a result, the past several years have seen the average incoming energy at newly constructed facilities (measured as daily kilowatt-hours per square meter) drop by about 20 percent.
That has helped cause a large spread in what's called the capacity factor, which is calculated by dividing the amount of energy produced at a facility by the maximum energy it could have generated if it produced 24 hours a day. The median capacity factor of solar plants in the US was 24 percent, but outliers were as low as 9 percent and as high as 35 percent. As prices continue to fall, this spread may become more pronounced, with more plants at the low end of the range.


3175x175(CURRENT).thumb.jpg.b05acc060982b36f5891ba728e6d953c.jpg)


Recommended Comments
There are no comments to display.
Join the conversation
You can post now and register later. If you have an account, sign in now to post with your account.
Note: Your post will require moderator approval before it will be visible.