

Three charts from the world of research, selected by Nature editors.
Graduate students speak out about racism
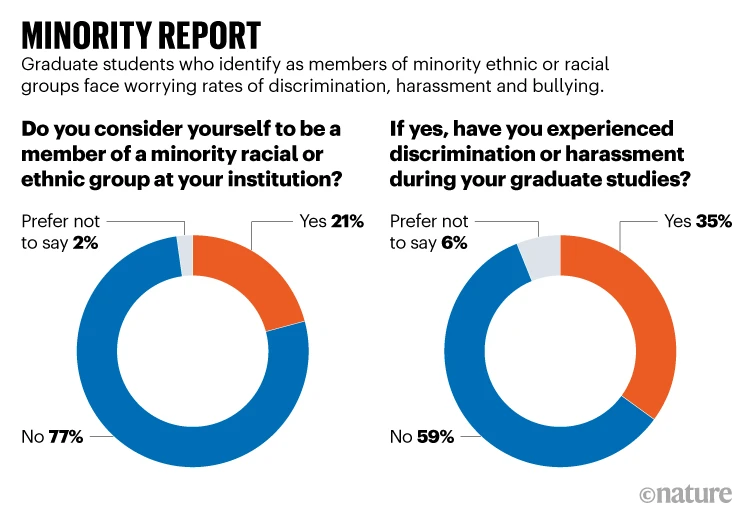
Thirty-five per cent of graduate students from minority racial or ethnic groups have experienced discrimination or harassment during their current programme, according to responses to Nature’s survey of PhD and master’s students. That’s more than twice the rate reported by those who did not identify as members of those groups (15%). Twenty-one per cent of respondents identify as members of minority racial or ethnic groups in the countries where they currently live.
Minority report: Results from Nature’s graduate survey, focusing on responses from members of minority ethnic or racial groups.
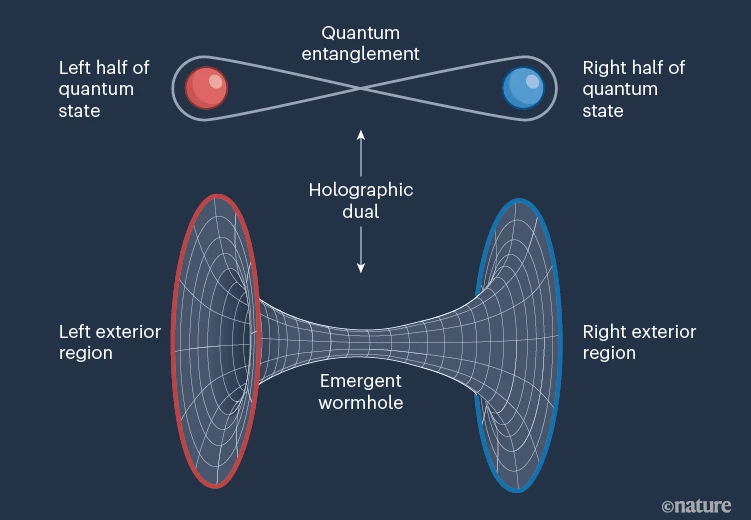
A holographic wormhole in a quantum computer
Physicists have used a quantum computer to generate an entity known as an emergent wormhole. Quantum systems can be linked by entanglement even when separated by extremely long distances. The authors generated a highly entangled quantum state between the two halves of a quantum computer, creating an alternative description, known as a holographic dual, in the form of an emergent wormhole stretched between two exterior regions. They then simulated a message traversing this wormhole. Such exotic physics is part of efforts to reconcile quantum mechanics with the general theory of relativity.
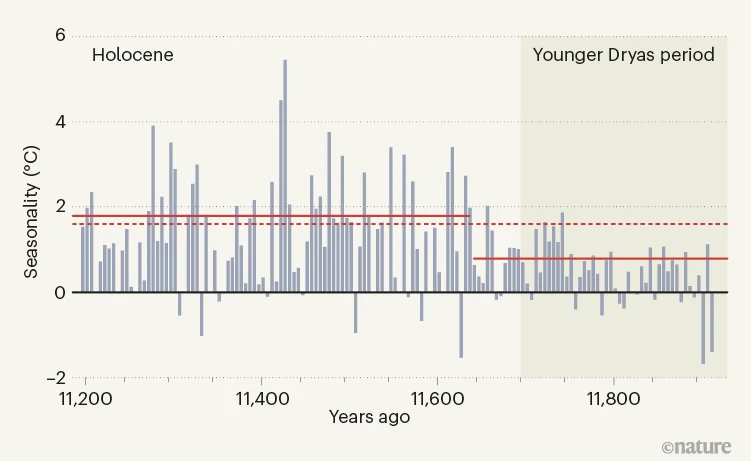
Seasons of the ancient ocean
Seasonal variation in tropical sea surface temperatures doubled during a sudden warming event 11,700 years ago, as this graphic shows. The authors of a Nature paper studied sediment layers off the coast of Venezuela to infer sea surface temperatures during the abrupt transition between a period of cooling (the Younger Dryas cold event) and the current epoch (the Holocene). This revealed the increase in seasonality, calculated as the difference between the average sea surface temperature in different seasons. The seasonality increased from 0.8 to 1.8 °C (solid red lines), which is close to the present-day seasonal variability of 1.6 °C (dashed red line). The study shows that seasonal changes must be considered when inferring past climatic events, and predicting those to come.
doi: https://doi.org/10.1038/d41586-022-04365-1
Recommended Comments
There are no comments to display.
Join the conversation
You can post now and register later. If you have an account, sign in now to post with your account.
Note: Your post will require moderator approval before it will be visible.